
Keep track of your energy consumption.
.png)

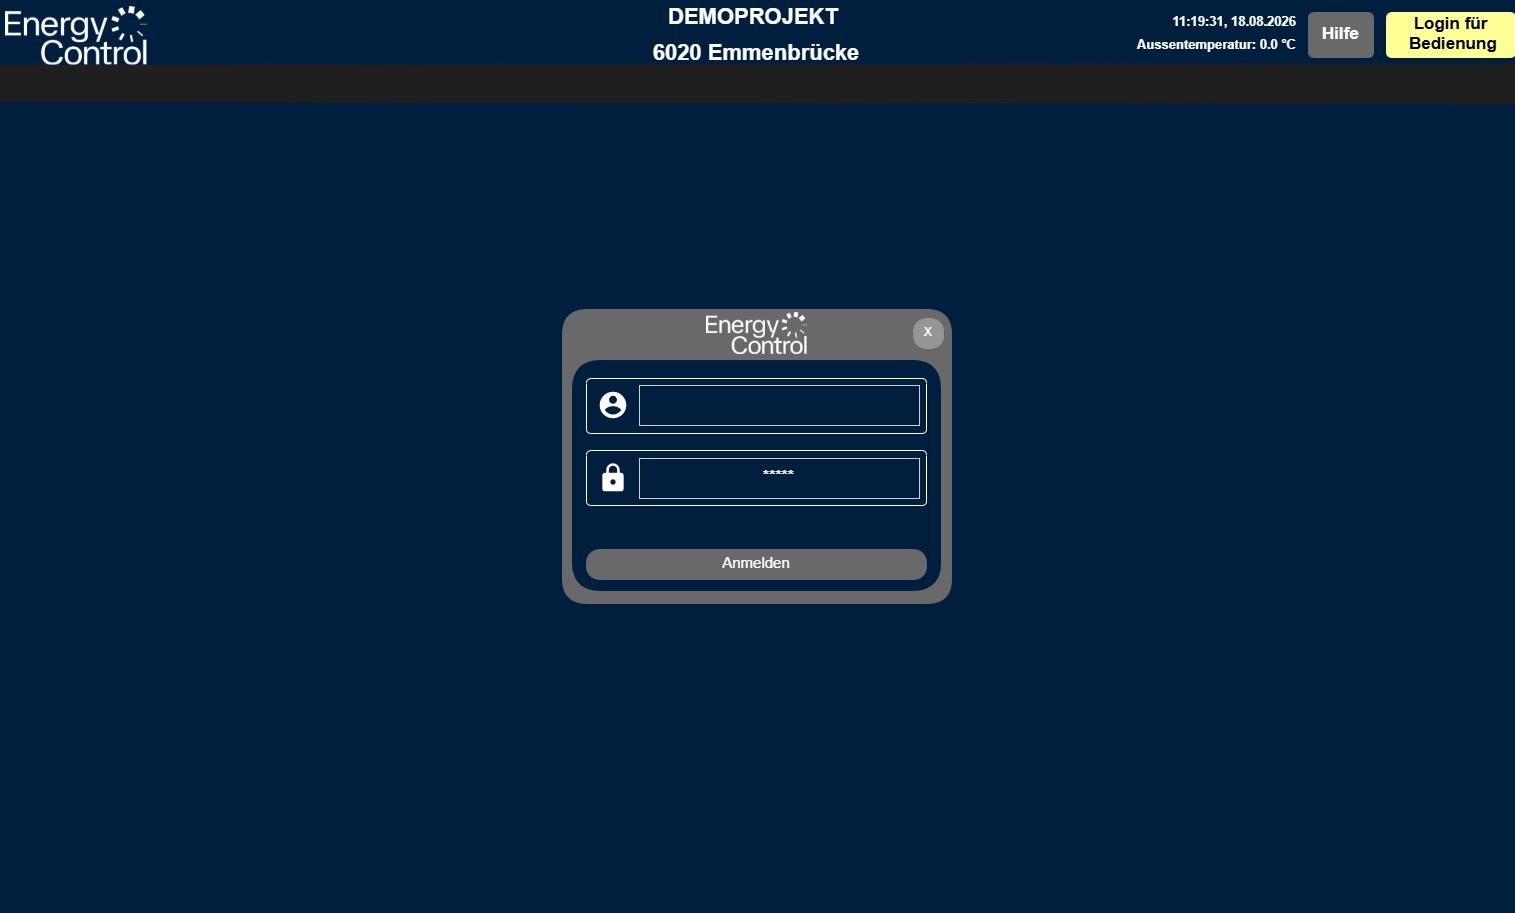

The free HTML visualization provides you with full visualization and control options. Depending on the logged-in user, the visualization displays either all or restricted details.
You will receive the link to access your visualization in a separate document. Enter this into your web browser or click directly on the link in the document.
When you click Login, a sign-in window will appear. Enter your username and password there.
Resident
Administration/Caretaker (additional displays)
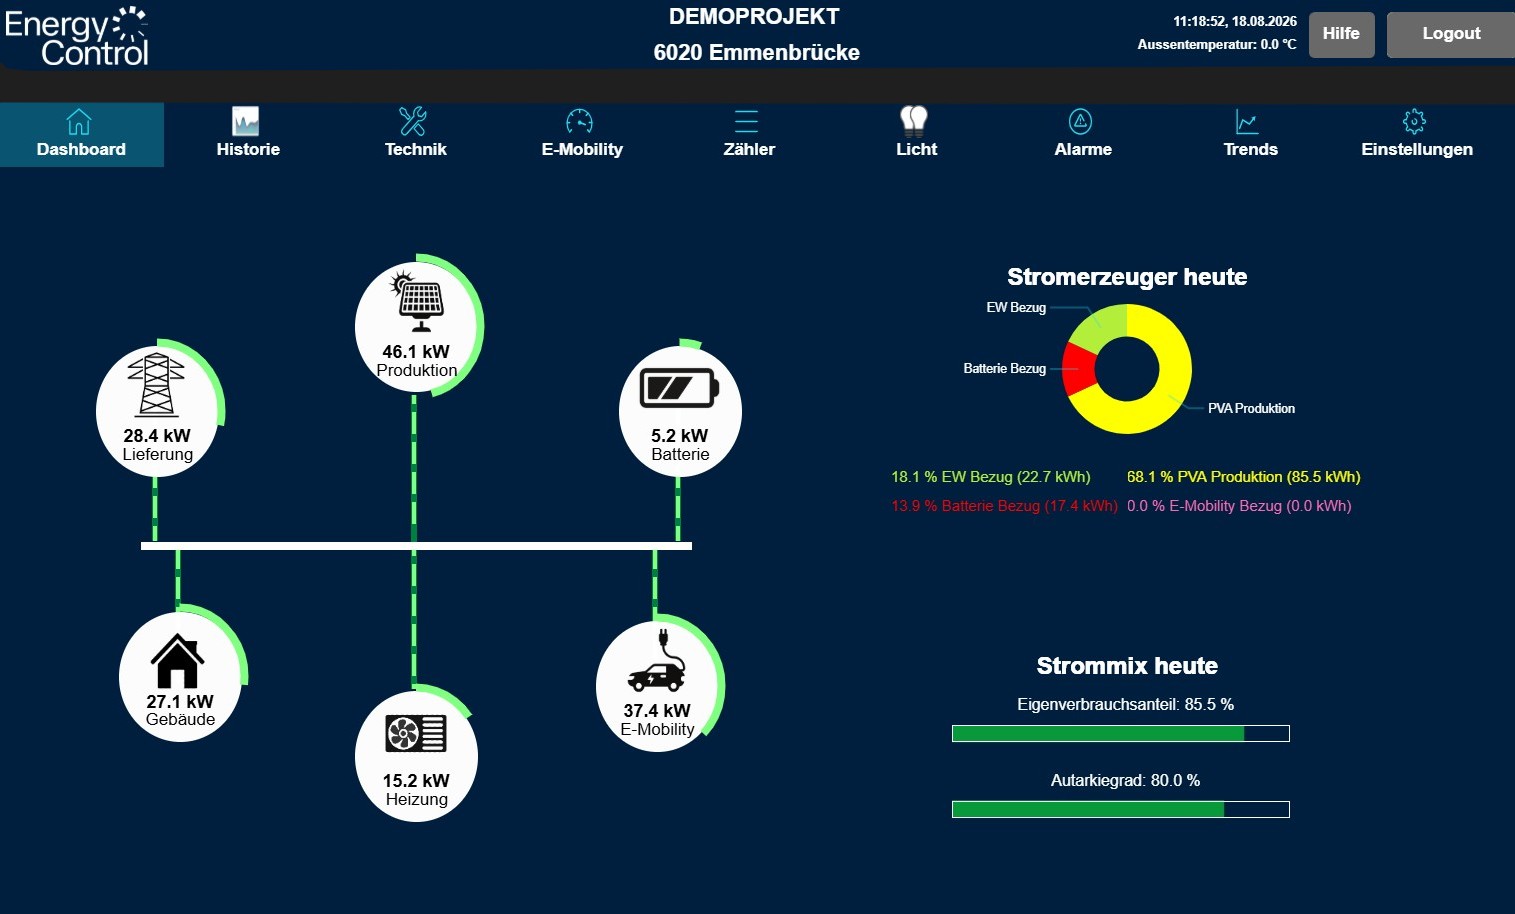
Once you have successfully logged in, the ENERGYControl dashboard will appear. This is the home screen of the interface, providing a clear overview of general power flows. At the top, you can see flows to and from the utility grid, PV production, and the battery. At the bottom, you will find consumption data for the building (apartments, elevator, etc.), heating, and e-mobility. On the far right, the energy mix for the current day is displayed, along with your current self-consumption rate and degree of self-sufficiency.
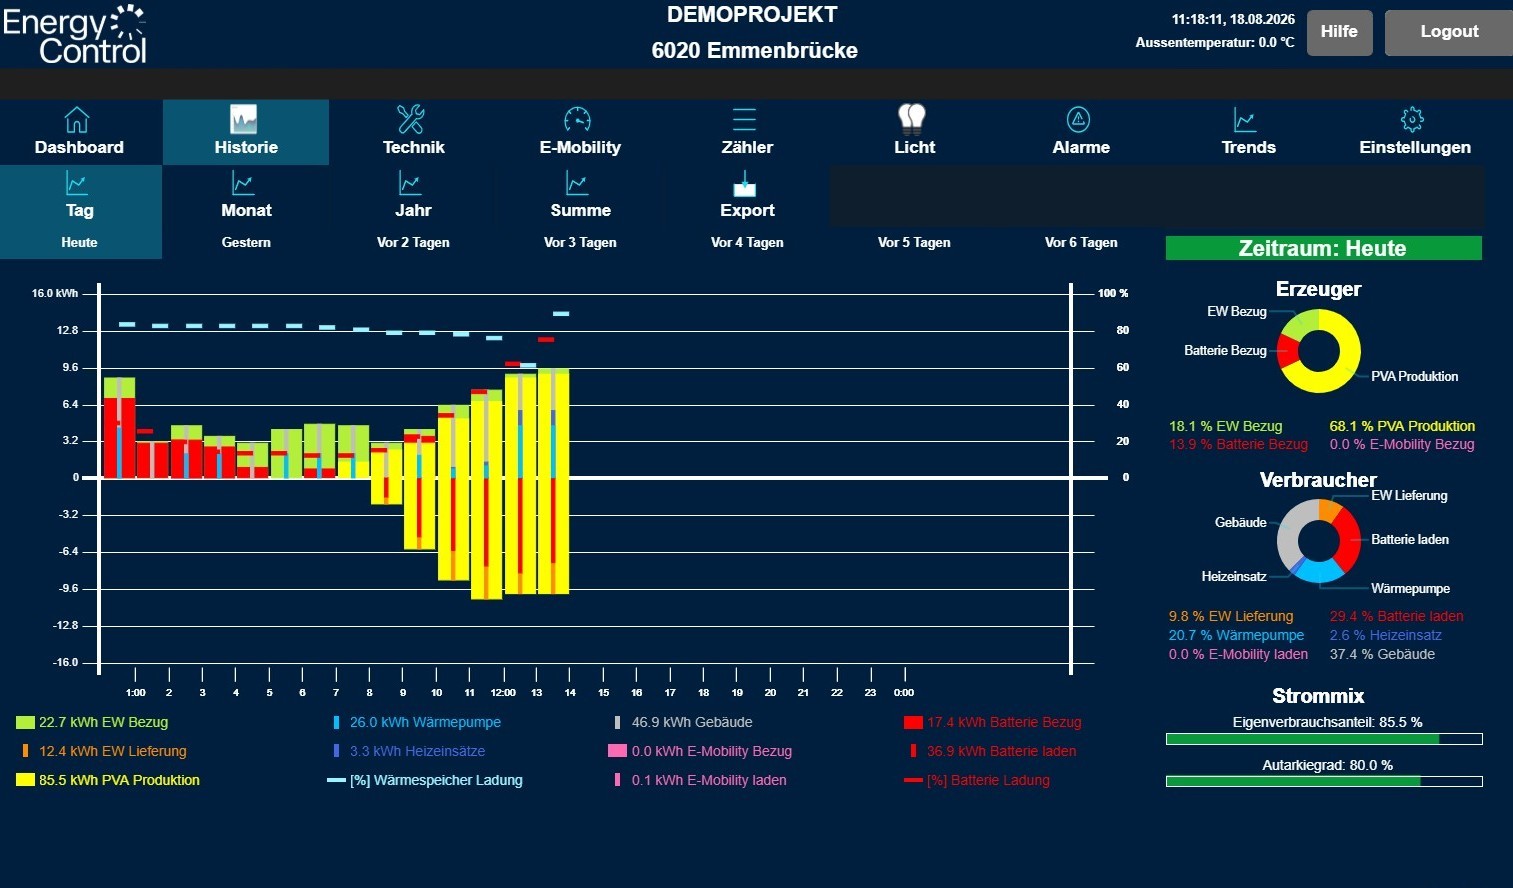
The history view provides a clear summary of all relevant electricity data, with a selectable resolution ranging from hours to years. The wide bars indicate the energy source: yellow = PV, green = grid, red = battery, pink = bidirectional e-mobility. When a bar drops below the 0kW line, energy is being fed back into the grid (indicated by a thin orange bar). The narrow bars within the wide bars represent power consumption: light blue = heat pumps, dark blue = heating elements, violet = e-mobility, red = battery storage, orange = grid feed-in, pink = e-mobility. The lines show the cumulative charge levels of the storage systems as a percentage: blue = domestic hot water and heating water tanks, red = battery storage.
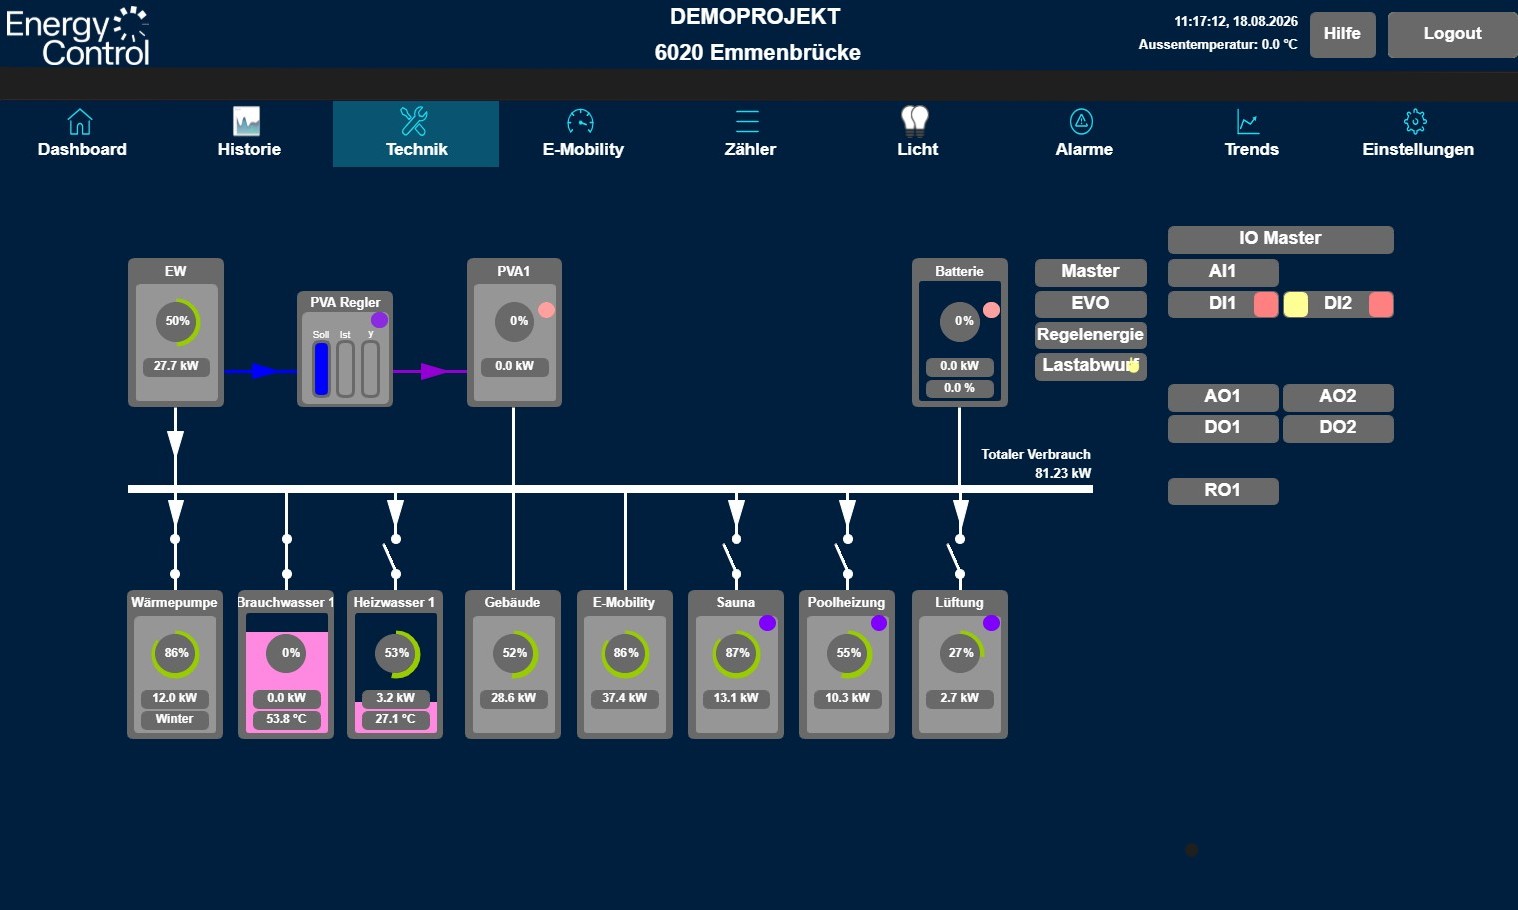
The technical diagram illustrates the grid feed-in, the PV system(s), and energy consumers such as heat pumps, domestic hot water and thermal storage tanks, EV charging stations, and the building itself (the sum of all non-controllable loads such as apartments, common area electricity, elevators, etc.). The diagram provides a clear overview of all power generators and consumers, showing current energy flows. The white bar in the center represents the main busbar (main distribution board) to which all devices are connected. Clicking on individual elements opens a popup—depending on the user's access permissions—that displays detailed status information and parameter settings. Utility: If this value is positive, the property is currently drawing power from the utility grid. If the value is negative, power is being fed back into the utility grid.
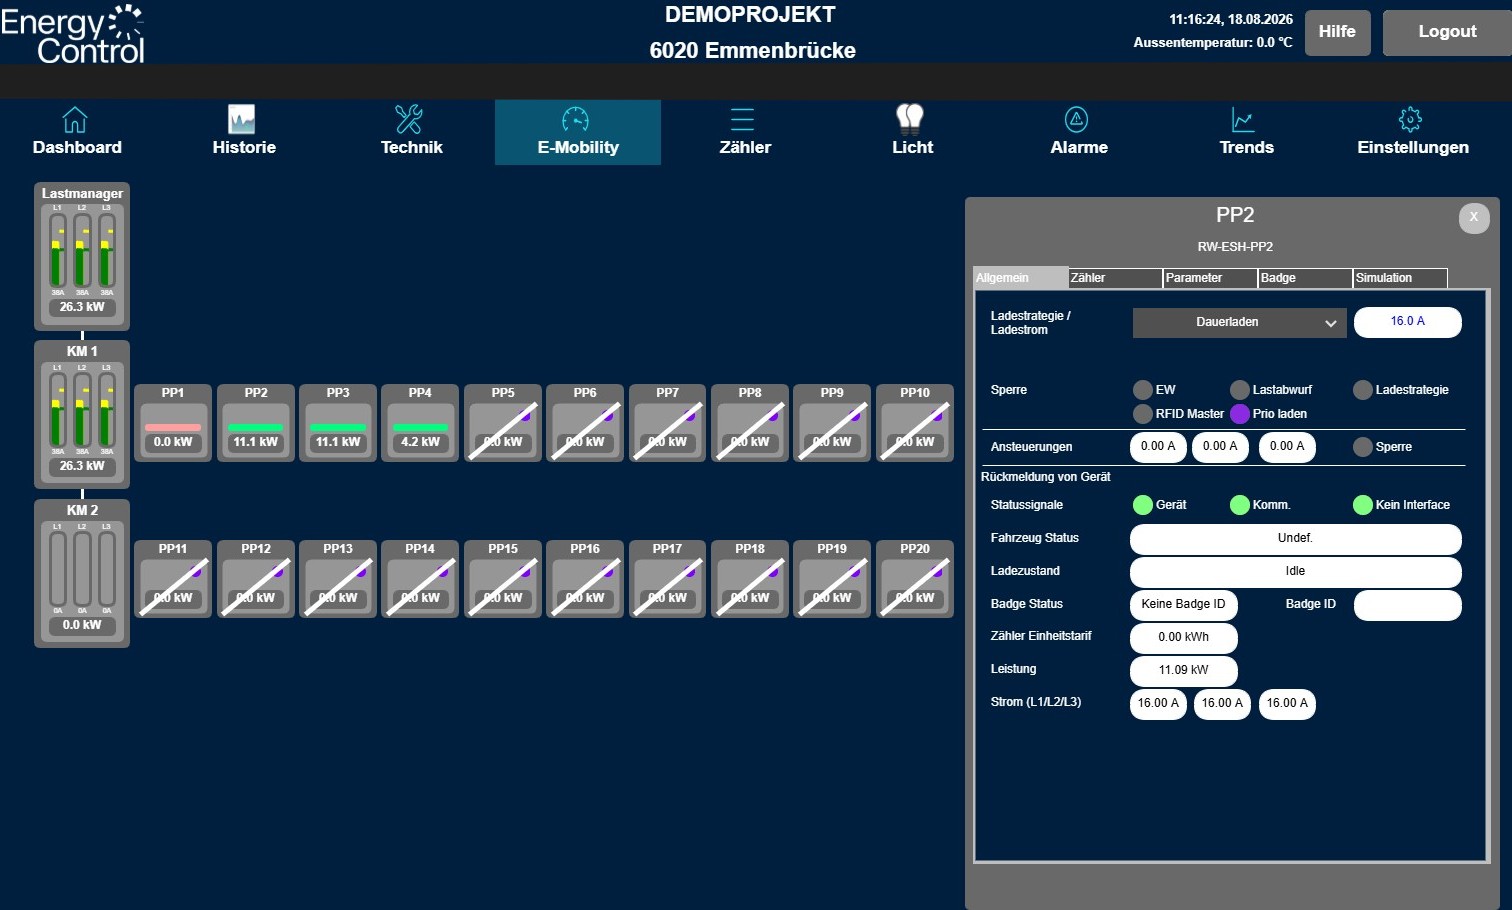
The e-mobility screen displays the respective charging stations, the flat cables, and the load manager. This overview allows you to monitor the current status of your e-mobility setup. The flat cable is represented by a white line next to the cable manager. Clicking on individual elements opens a popup—depending on the user's permissions—that displays detailed status information and parameter settings.
Load manager: The load manager collects power requests from all cable managers and allocates the available power to them. It ensures that the main building connection fuse and the main e-mobility fuse(s) are not overloaded.
Cable manager: For each flat cable (fuse output), a cable manager collects requests from the connected charging stations and reports them collectively to the load manager.
Charging station: The charging station module communicates directly with the connected e-mobility charger, regardless of the manufacturer or model. It reads the batch ID when the user logs in, authorizes the charging station for use, and controls the maximum current allowed for the charging process. Once authorized, the vehicle can begin charging. Users can select their charging strategy via the app at any time: solar charging, solar/night charging, budget charging, prioritized charging, etc. If a fault occurs, it is indicated by a red border.
Status circles: Status circles indicate that an element is not in its normal state. You can select the element for more information. Further details are visible in the popup. Possible states: The element has a fault / The element is not authorized. Relative power value: Shows the power being drawn by the element.
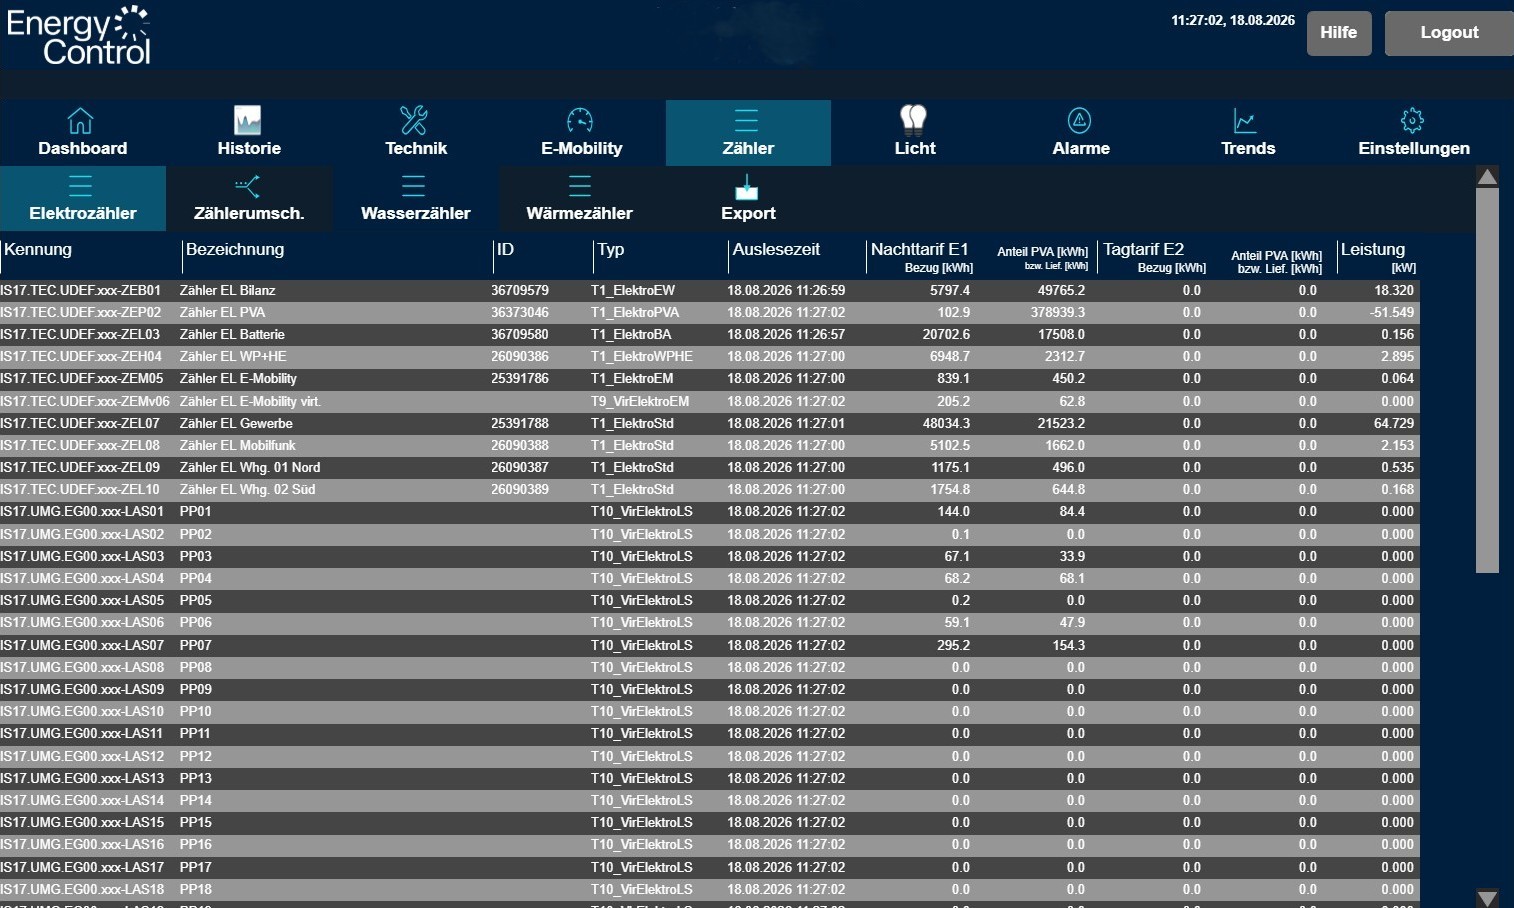
The read meter data is monitored, validated, and made available to higher-level systems for billing. If meter readings fail the validation test or if meters malfunction, an alert is triggered. All meter values are saved once daily in the local database and can be sent via email as a CSV file, either automatically at your preferred intervals or manually for a specific reference date. You can use the CSV file to process billing manually or to import the meter data into another system.
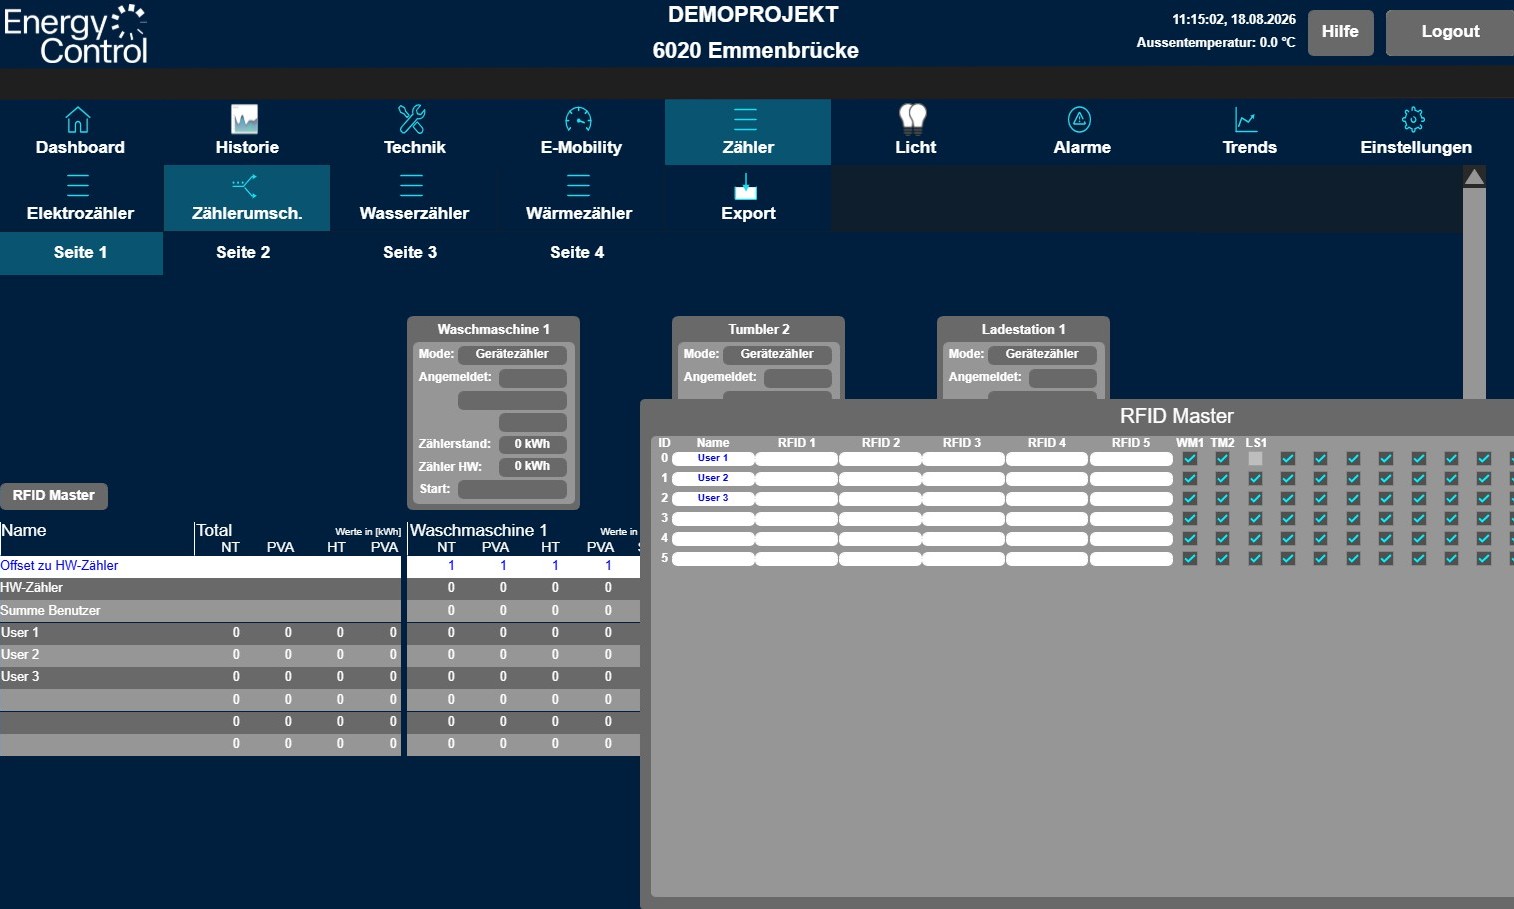
The visualization displays the RFID Master with its settings, as well as the RFID batch readers. Clicking the "RFID Master" button opens a window where all IDs, names, and permissions can be configured for each device. All devices that can be unlocked via RFID batch are equipped with an on-site RFID reader, allowing users to log in.
In the version with an individual device meter, the power consumption of each specific appliance (e.g., washing machine) is measured by a separate electricity meter. The actual consumption per user is calculated based on this electricity meter (virtual meters). The sum of all users' virtual meters must always match the absolute value of the hardware meter; otherwise, an alarm is triggered. In addition to the RFID Master and the RFID batch readers, the visualization displays the electricity meters for the appliances and the accumulated virtual meter readings per user.
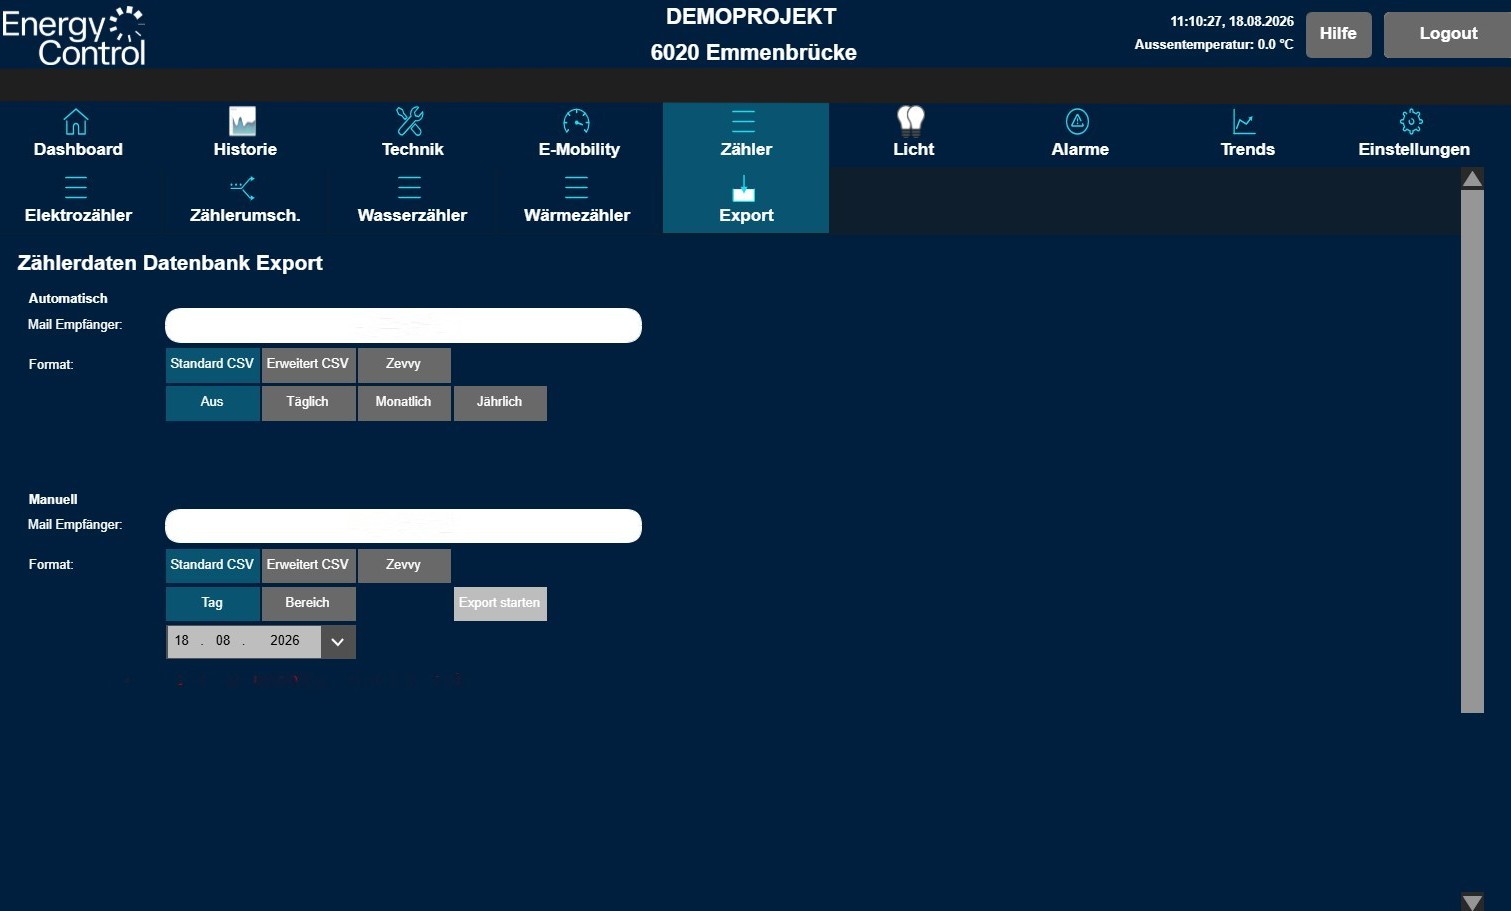
Meter data can be exported and sent as a CSV file to registered email recipients either automatically or manually under the Meters > Export tab. You can choose between the standard format or the Zevvy format, ensuring the file is formatted either for optimal readability or for direct import into the Zevvy utility billing system. Meter data can be exported automatically on a daily, weekly (1=Mon…7=Sun), monthly, or yearly basis at any time of your choosing. In addition, you have the option to export data for a specific reference date or for a custom range by entering the dates manually. The "Newest Entry" and "Oldest Entry" buttons allow you to export the most recent or oldest data from the database at the touch of a button.
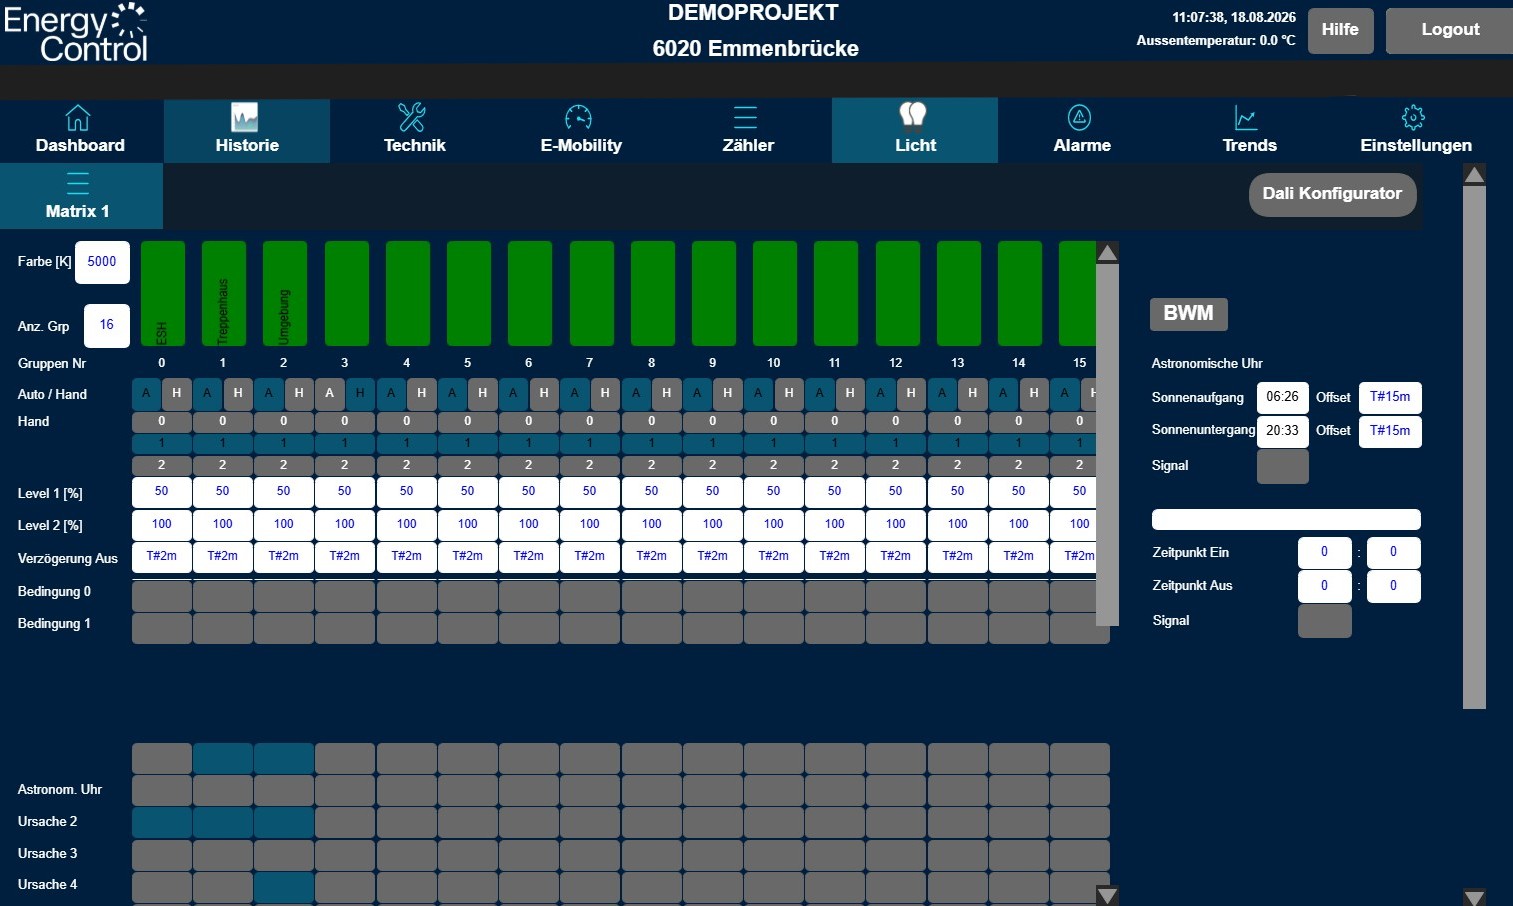
The lighting control function allows for simple, flexible configuration of lighting groups in stairwells, basement corridors, parking garages, and outdoor areas. Input signals from push-buttons, motion detectors, and brightness or presence sensors can be integrated via KNX, DALI, or digital input signals. Within ENERGYControl, you can graphically configure which push-button and sensor signals correspond to specific lighting groups, as well as define switch-off delays, brightness levels, and timers. Based on these settings, the lights are then controlled via DALI, KNX, or digital output signals. For commissioning, the WAGO DALI Configurator is fully integrated, and all lighting groups can be manually controlled directly through the ENERGYControl visualization.
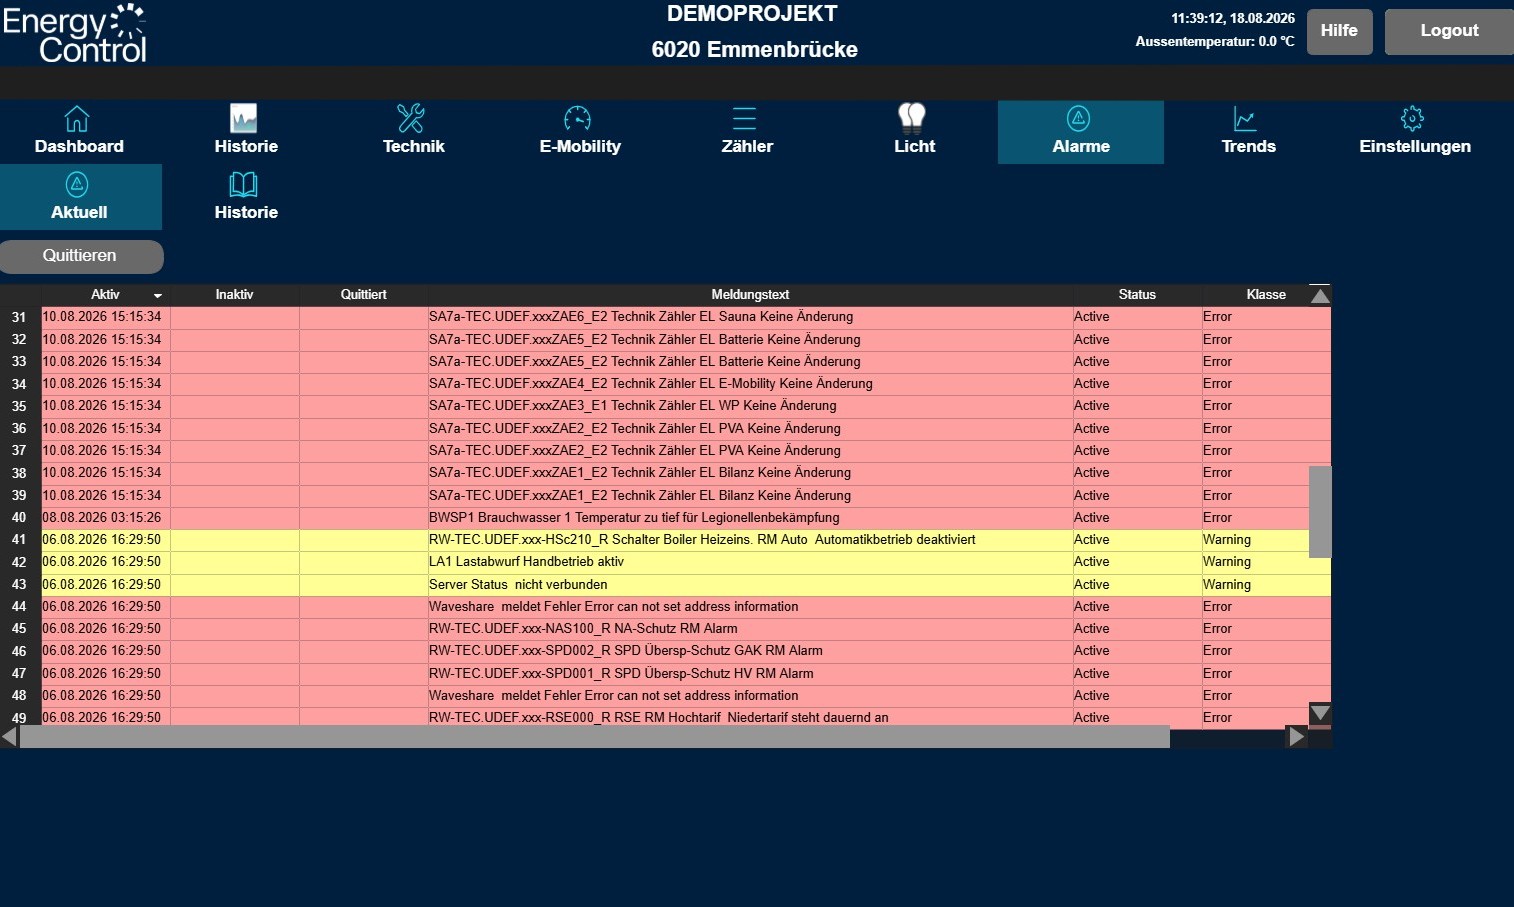
ENERGYControl includes a comprehensive alarm server featuring various notification and alarm priorities, an alarm history, and active alerting via email (included) and SMS (available for an additional fee). All alarms—such as low domestic hot water temperatures, heat pump or inverter malfunctions, failure to reach legionella protection thresholds, meter monitoring, and more—are recorded and can trigger notifications via email and SMS. In addition to internal alarms, external alarms can also be integrated and reported (e.g., CO2 systems, sump pump monitoring, underground garage doors). Both active alarms and the alarm history can be viewed on the visualization interface. Alarms can be acknowledged by users with the appropriate permissions.
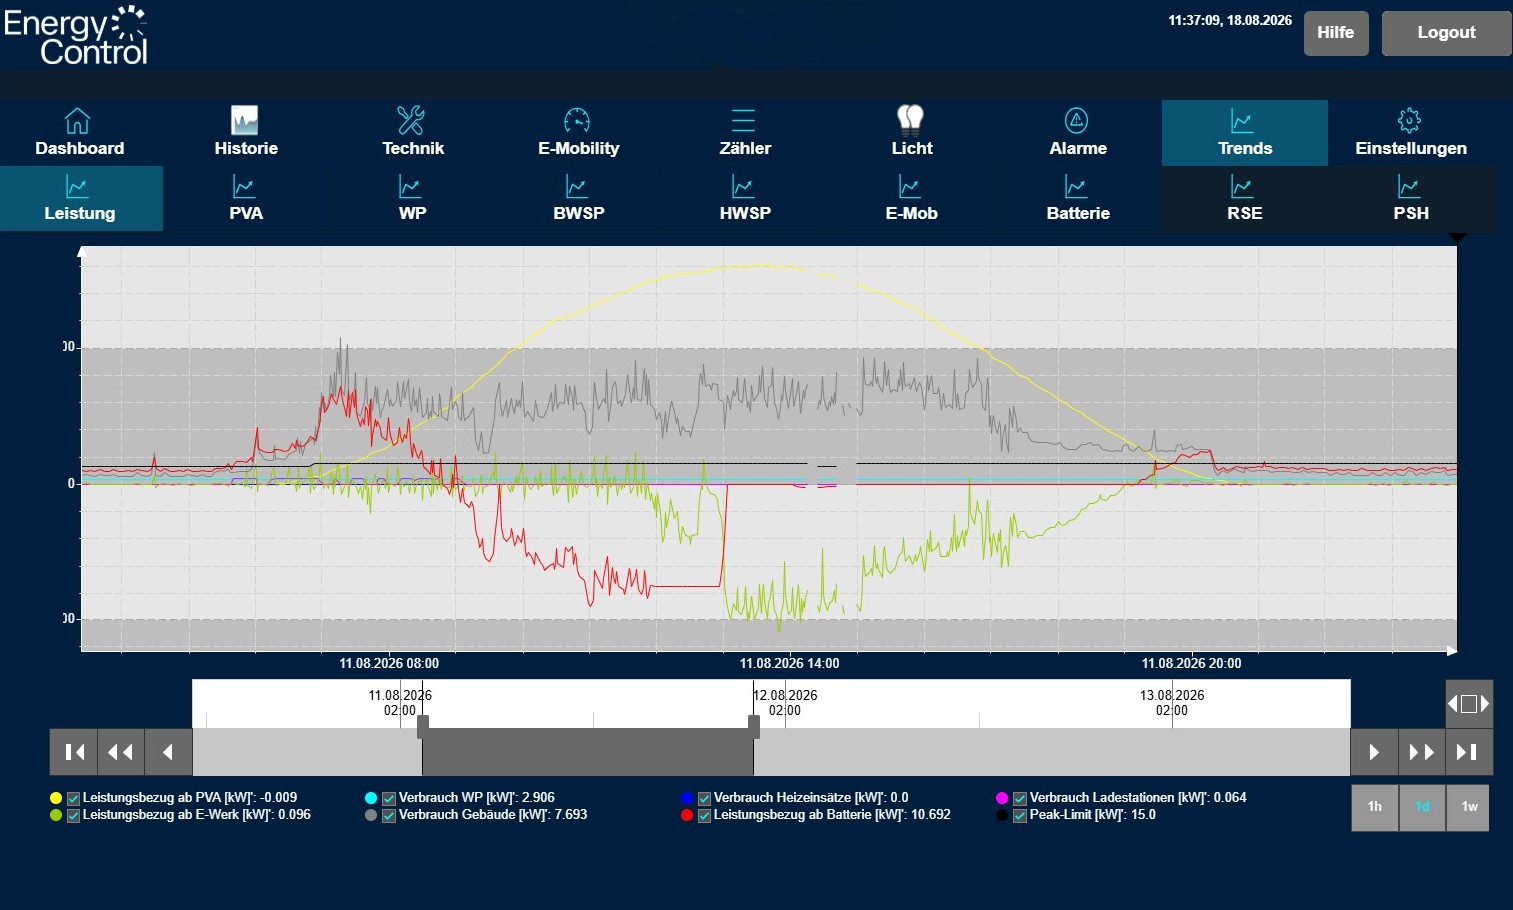
Trend charts provide detailed logs and are intended for technicians. Timeline: Use the buttons to select the time range for the display width: 1h = 1 hour, 1d = 1 day, 1w = 1 week.
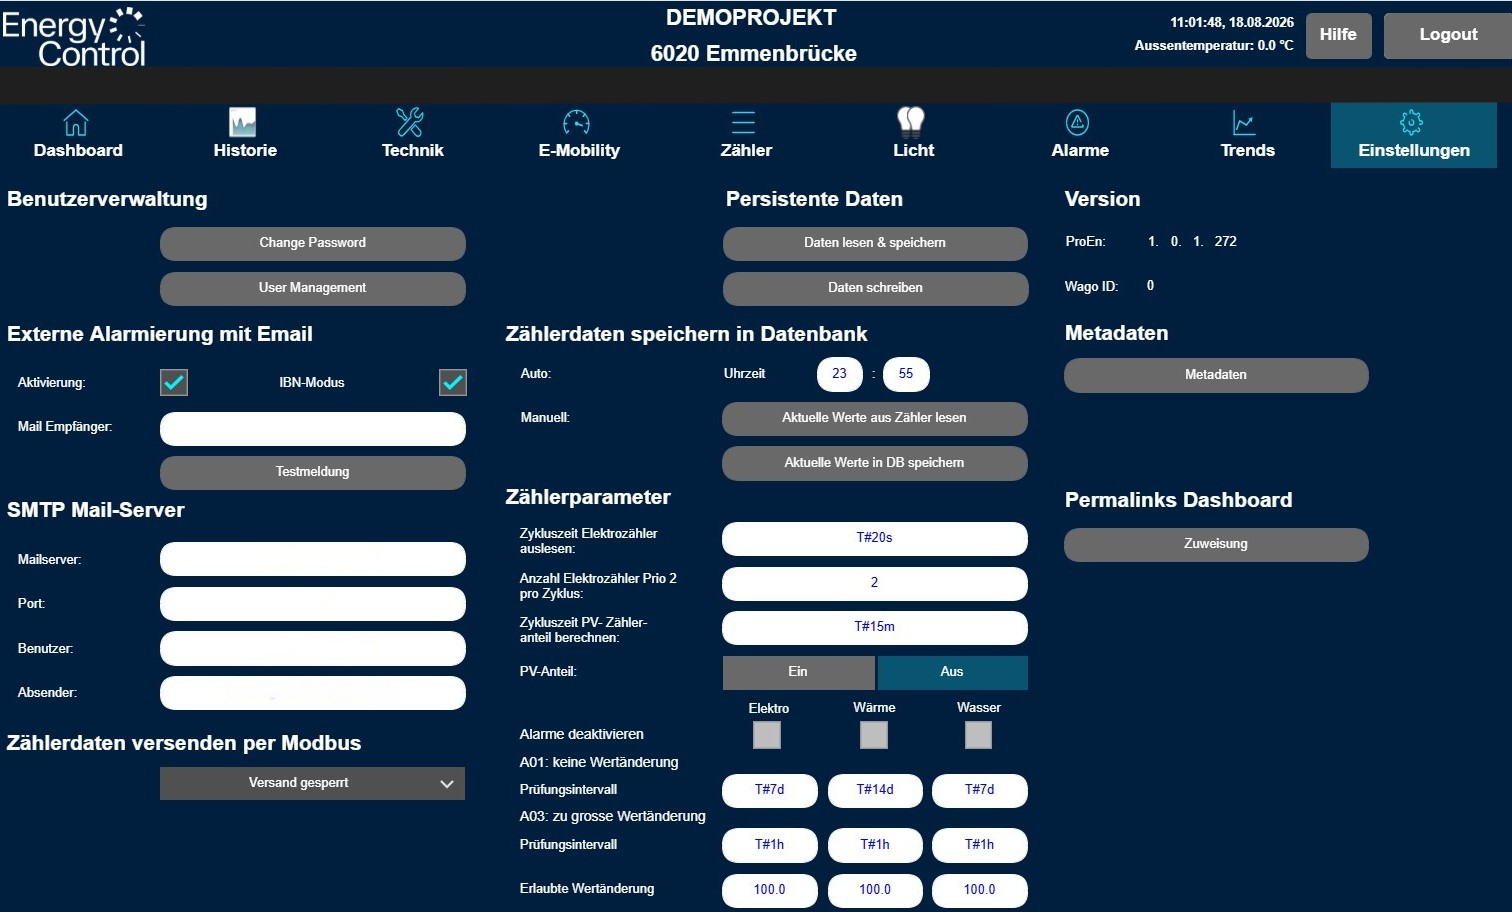
Use the Change Password button to update the current user's password. Depending on your permissions, the User Management button may also be available, allowing you to manage permissions and passwords for all users. System-generated alarms can be sent to one or more email addresses. Simply enter the desired address in the Mail Recipient field (separate multiple addresses with a semicolon, e.g., prola@prola.ch;buildings@prola.ch). If you do not require external alarm notifications, you can disable this feature using the activation button. If meter data is being continuously transmitted to zevvy for automated billing, you can manually override this transmission here to initialize the meter data in zevvy.